| Dauger Research Vault | ||
| Tutorial | |||||||||||||||||||||||||||||||||||||||||||||||||||||||||||||||||||||||||||||||||||||||||||||||||
|
|||||||||||||||||||||||||||||||||||||||||||||||||||||||||||||||||||||||||||||||||||||||||||||||||
|
Visualizing Message Passing with MacMPI
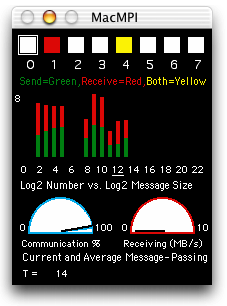
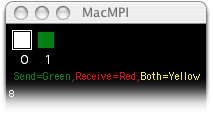
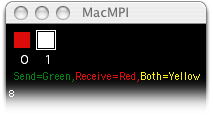
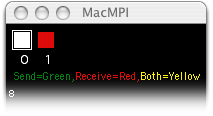
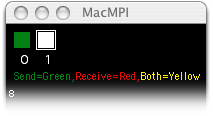
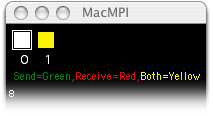
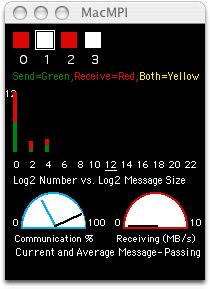
But how do we get a handle on seeing how our code is exhibiting the correct message-passing behavior? MacMPI's monitor window is designed to help with that by displaying what it can about the ongoing state of the parallel code in a window. If the code isn't running as we had in mind, the monitor window can help there too by displaying what's really happening. It will freeze on the culprit message state if a deadlock occurs, and it will reveal when the code is sending too many small messages. If you are learning about parallel code, the following gives an idea of how to use this aid with development of message-passing codes. Deconstructing the Monitor Window MacMPI's monitor window has three major sections. The square lights at the top of the window display the message passing pattern of the parallel computing job as it is at the moment. Below that is a histogram of the number of messages sent and received as a function of message size in a log-log format. At the bottom are two dials, one displaying the percentage of time spent communicating and the other is a measure of bandwidth. Each display instantaneous and average estimated quantities. Basic Message Passing Let us consider what happens when we run a simple message-passing code. Running the Parallel Knock code example as two tasks, we perform a simple message pass from task 0 to task 1, then back again. MacMPI displays this message passing sequence in its monitor window as follows.
After the MPI calls return, knock has each task print the message, then proceeds to the reply.
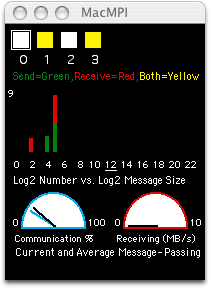
Knock's sends from 0 to 1 and back again, and MacMPI's monitor window displays this pattern in color as the communication occurs. Deadlocks A common error for novices in MPI programming is a deadlock condition, where the code hangs because the MPI cannot complete the message passing as given by the code. Consider an extension of the Parallel Knock example above: what if we want the messages to be exchanged simultaneously, rather than one way then the other? The novice, thinking that the receives and the sends should be performed at the same time, might rewrite the code like this:
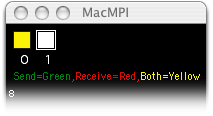
MacMPI's monitor windows will therefore report this:
and the code will hang indefinitely. Each task is waiting for a message from the other, but MPI_Recv won't return until it finished receiving a message from the other. That prevents either from calling MPI_Send, so this code stops here. Depending on the message length and the network infrastructure, a similar deadlock can occur if they both call MPI_Send first:
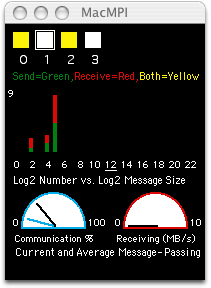
The fix is to use an asynchronous receive call, MPI_Irecv, and follow the MPI_Send call with a MPI_Wait, like this:
Each task sends and receives at the same time, indicated with yellow.
Deadlocks can occur between more than two tasks that are much more complicated than those above, but the principle is the same. Optimizing parallel code Especially for IP-based Ethernet networks, two benchmark numbers almost entirely characterize network performance: bandwidth and latency. Bandwidth is the maximum amount of data that the network can send in a given time. However, latency, the time it takes to for a one-byte message to arrive at its destination after leaving its source, is what most often limits how many processors can be used on a given problem. Anyone who has waited for a web browser to start loading a new page after clicking its link has experienced network latency first-hand: High bandwidth makes the page load fast once it starts; latency is how long it takes the first byte to arrive. Sooner or later, these latency issues will limit a parallel code's performance. The trick is to optimize your code to minimize latency's effects. A very effective way to do that is to aggregate smaller messages into fewer, larger ones whenever possible. Your code will then take the best possible advantage of the bandwith the network can provide, rather than be limited by its latency. Optimizing your code on a Mac cluster with a common network like 100BaseT reveals latency's effect on your code sooner, so that if you optimize it there, your code will perform that much better when you do get the opportunity to use a large system with a much better network. MacMPI's monitor window can show when a parallel code is sending a large number of short messages in its histogram section. As an example, let's consider a correctly executing but poorly optimized version of the message passing in the Parallel Life tutorial.
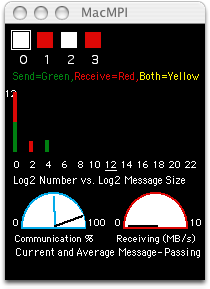
This code has each process send messages to its neighbors, one byte at a time. When run on a four-processor system, MacMPI displays these:
MacMPI is reporting a large number of one-byte messages accumulated on the left edge of its histogram. In addition, it is reporting that the code is spending a relatively high amount of time communicating via the blue dial named "Communication %". On average almost 90% of the time is spent communicating. This is a poorly optimized code. We can improve the performance by having the code organize the appropriate data sequentially so that it can be sent as one large message per neighbor.
The best thing to do is to have the code collect the data as large messages and have pairs of processors swap data with each other.
This code has each process send messages to and receive messages from its neighbors. On a four processor system, MacMPI displays these:
In reality, the lights would be white interrupted by brief, non-simultaneous flashes of yellow. We can see in the histogram that the bulk of message passing is at a much larger message size (24-byte messages in this case) and much fewer in number (hundreds of messages down from tens of thousands). These 24-byte messages are as large as we can efficiently make them because that is all the data this particular code needs to transmit at each time step. The performance improvement is also seen in the "Communication %" dial, which is reporting at least a 60% drop in time spent communicating. Those witnessing the code run can see a substantial performance improvement, corroborating these measurements.
The purpose of this discussion was to show how to use MacMPI's visualization features to help debug and optimize parallel code. In practice, its users leave this window on while the code is running. Only when the user is certain the code has achieved a highly optimized status and wishes to maximize overall performance is this monitor window turned off to minimize overhead. These windows make experimenting and working with parallel computing much easier and more interactive. We have colleagues who were able to discover useful insights into their code in minutes using MacMPI's monitor window that would have taken weeks to understand without it. Besides the ease with which it can be compiled and linked with typical codes, this message-passing visualization tool is one of the primary reasons we recommend using MacMPI. The reader is welcome to explore the possibilities. You're welcome to read more about parallel computing via the Tutorials page.
|
|||||||||||||||||||||||||||||||||||||||||||||||||||||||||||||||||||||||||||||||||||||||||||||||||