| Pooch | ||||||||||
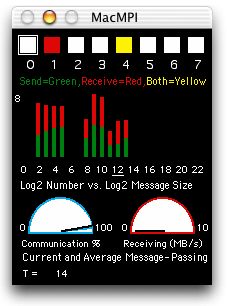
This monitor window is toggled using a variable named "monitor" in the MacMPI library. When the code is finished MacMPI outputs the accumulated history of the messages sent during the run. When monitor is set to 2, a log of all the messages sent and received is produced in the same file. You can see this feature demonstrated using the pingpong codes in the Pooch SDK and by activating the MPI Monitor Window item under the Parallel menu of the Fresnel Diffraction Explorer when it is running in parallel. This feature is available exclusively in the Fortran and C versions of MacMPI_X and the C version of MacMPI_S.
For an in-depth description on how this window
responds to a parallel code and how to use it to
debug and optimize code, see the
Visualizing Message Passing with MacMPI tutorial.
|
||||||||||

